Case ID: PDXBR22-000001
Patient: Test, Sample
MRN: TEST-999
DOB: 1/4/1956
Gender: F
Age at Dx: 90
MRN: TEST-999
DOB: 1/4/1956
Gender: F
Age at Dx: 90
Physician: Sample Test, MD
Report Date: 1/8/2022
Surg.Path.No: 9999
Collection Date: 1/4/2022
ICD10 Code: C50.912
Report Date: 1/8/2022
Surg.Path.No: 9999
Collection Date: 1/4/2022
ICD10 Code: C50.912
Grade: 3
pT: 2 pN: 3 pM: X
Path Stage: IIIC
Tumor Size: 4.1
Pos. Lymph Nodes: 10
pT: 2 pN: 3 pM: X
Path Stage: IIIC
Tumor Size: 4.1
Pos. Lymph Nodes: 10
Model Features
- < Low RiskHigh Risk >
- RISK SCORE88▼

 AI Grade
 70▼
70▼

A
Age at Dx
Age at Dx
90
▼

S
Tumor Size
Tumor Size
4.1
▼
+LN
Pos LN
Positive LN
10
▼
TNM
Path Stage
Pathologic Stage
IIIC
▼
Key Findings
- High mitotic figures and nuclear pleomorphism
- Patient's higher age and tumor size are negatives
- Intermediate tubule formation despite overall aggressiveness
Confidential
Lymphocytes

lowest density
highest density
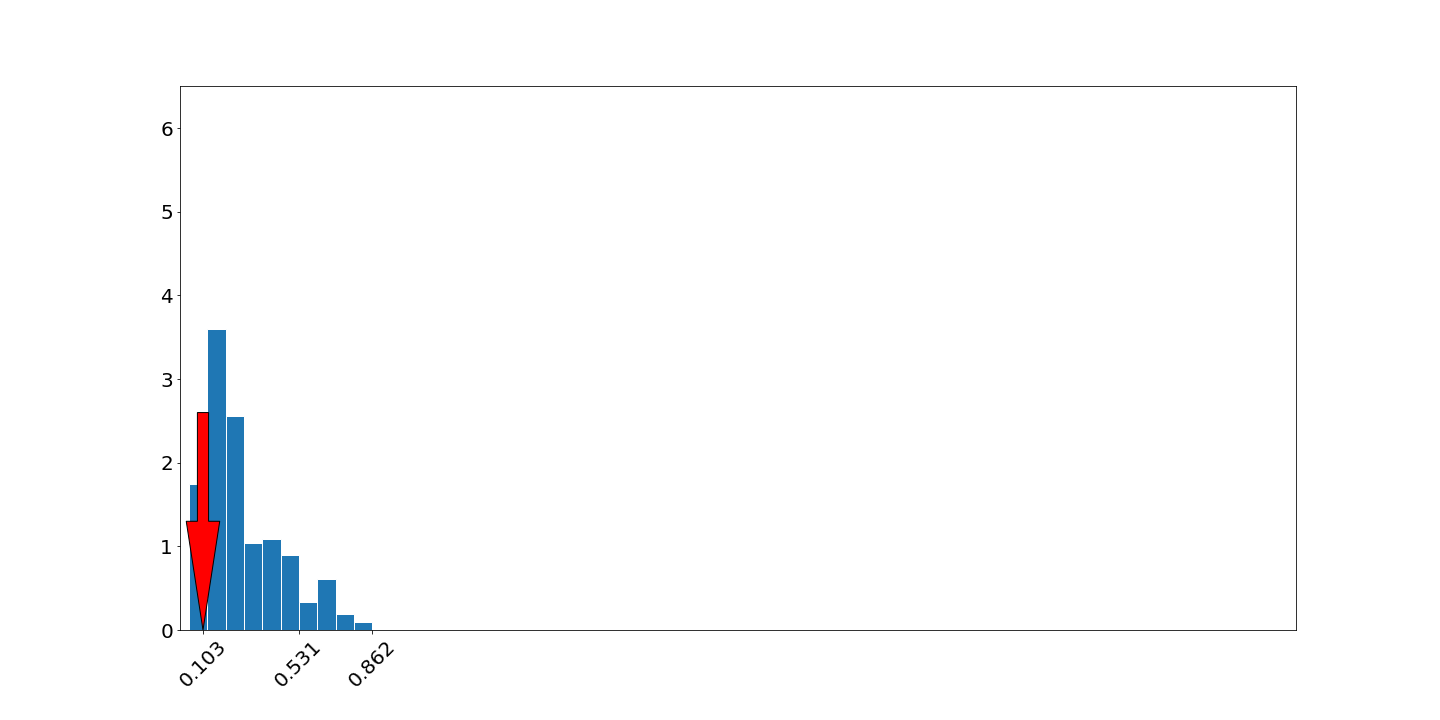
Nuclear Pleomorphism
Regional score = size of largest nuclei/size of smallest nuclei
Scale ranges from 1-12. Most pleomorphic regions are in yellow.
Max pleomorphism value: 11
Scale ranges from 1-12. Most pleomorphic regions are in yellow.
Max pleomorphism value: 11

lowest variability
highest variability
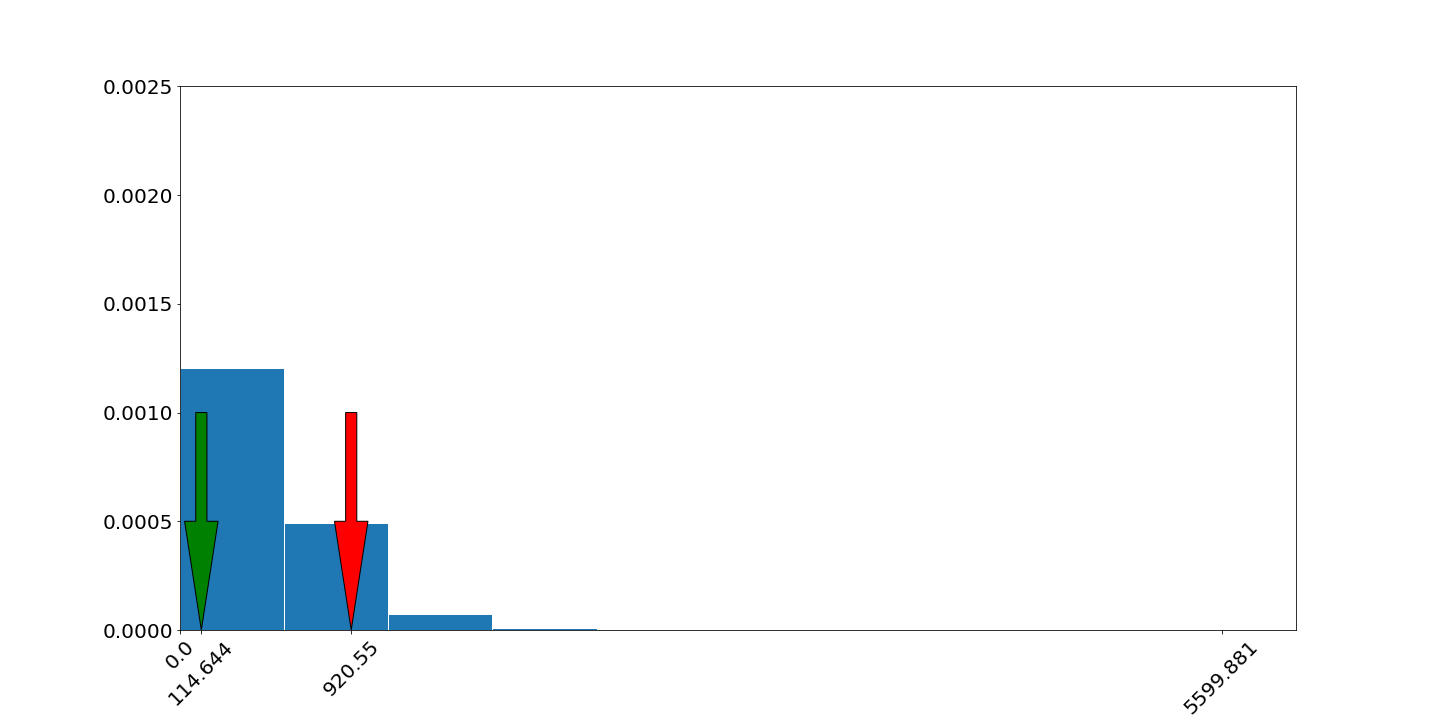
Mitotic Density
Proliferative activity of the invasive tumor is derived from mitotic figure counts. Mitotic figures detected are identified by a yellow box with a green box inset. Density is measured as total mitotic count divided by epithelial nuclei count in the invasive tumor area.
Tubules
Exclusively measures how well epithelium forms tubules as average max and min tubule scores across the whole slide. This is an independently predictive feature that complements other tubule related features.

low score
high score
Sheets
Sheet measurement exclusively measures sheet formation of the epithelium. This is an independently predictive feature that complements other tubule related features.
low score
high score
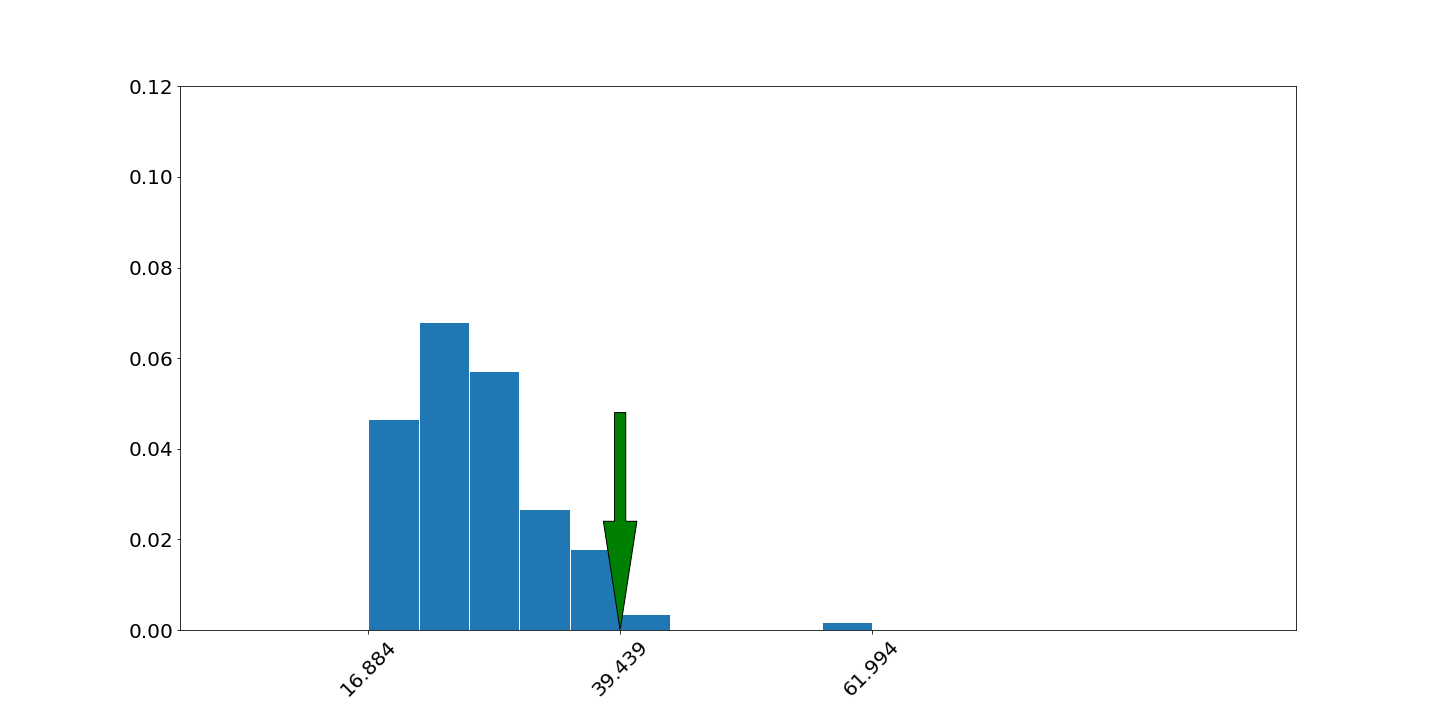
Neighboring Nuclei Index
Measure of local nuclei organization, using detections of nuclei with only 2 nearby neighbors that can be linked in an efficient way. This is a particular measure of tubule formation (that complements the more general tubule formation feature) with well formed tubules having a high degree of nuclei with only 2 neighbors and poorly formed tubules having many nuclei with more than two neighbors or only one neighbor (incomplete tubule). The feature is computed as the proportion of such nuclei compared to total nuclei in invasive cancer.
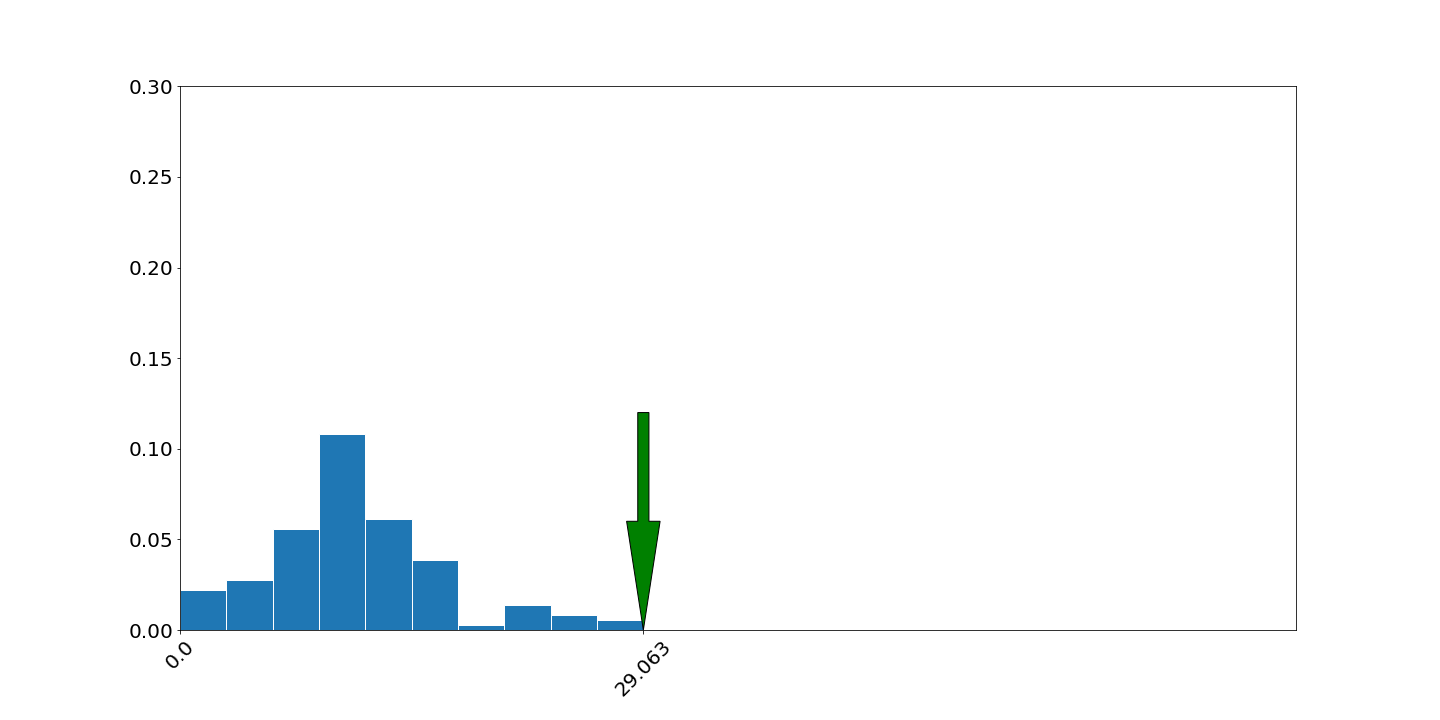
Tumor/Stroma Ratio
Proportion of stroma in invasive cancer regions.
Measured ratio: 1.18
Measured ratio: 1.18
Risk Score
